More than 90% of the Earth's crust is composed of silicate minerals, making silicon (Si), after oxygen, the second most abundant element in the Earth's crust (about 28% by mass).1 Approximately 20% of silicon minerals are refined to metallurgical-grade purity and then a smaller amount is refined to semiconductor-grade which is typically the nine-9s or better. The late 20th century to early 21st century has been described as the Silicon Age, because of the large impact that the elemental silicon has on the world economy. Highly purified elemental silicon used in semiconductor electronics is essential in the production of transistors and integrated circuit chips used in many areas of modern technology.
Monocrystalline silicon 2 of the highest purity is usually produced by the Czochralski process and utilized to produce silicon wafers used in the semiconductor industry, in electronics, and in some high-cost and high-efficiency photovoltaic applications. Polycrystalline silicon, also called polysilicon, is a key feedstock for production of monocrystalline silicon. Polysilicon contains impurity levels of less than one part per billion (ppb), when used in the electronic industry, while polycrystalline solar-grade silicon is generally less pure (four-five 9s).
Other forms of Si with variable levels of purity include amorphous silicon and upgraded metallurgical-grade silicon used in the production of low-cost, large-area electronics in applications such as liquid crystal displays and of large-area, low-cost, thinfilm solar cells. Metallic silicon, in any form, must be analyzed for contaminants, because their presence and concentration critically impact the final product in any application area. This paper describes silicon sample analysis using ICP-MS, focusing mainly on elements suffering from spectral interferences from polyatomic ions formed by Si, diluent acids and plasma gases.
Experimental
Samples and Sample Preparation
Polysilicon and wafer samples from several different sources were analyzed. Some were provided in liquid form and others in solids that required digestion. The digestion involved dissolution in 1:1 mixture of HF and HNO3 (Tamapure, semigrade, Tokyo, Japan) followed by dilution with ultra-pure water to the concentrations of 1000, 1500 and 2000 ppm Si. Final concentrations of the acid mixture varied from 2 to 6%. Calibrations were done by method of standard addition (MSA) and performed at different levels from 0 to 1000 ppt, depending on contaminant concentration in the samples. Spikes were made from 10 ppm multielement calibration standards (PE Pure, PerkinElmer Inc., Shelton, Connecticut, USA).
Instrumentation and Instrumental Conditions
ICP-MS is the most sensitive and accurate technique for trace elemental analysis. The NexION® 5000 Multi-Quadrupole ICP-MS 3 with the combination of its novel, second-generation Triple Cone Interface (TCI) with OmniRing technology 4, patented plasma generator, LumiCoil RF coil, Universal Cell Technology (UTC) with dynamic bandpass tuning 5 and multi-quad technology enhance the instrument's analytical performance and sensitivity, as well as reliability. Pure reaction gases (NH3 , O2 , H2 , NF3 and other) used in the Universal Cell along with dynamic bandpass tuning and multi-quad technology very efficiently remove spectral interferences, while actively preventing new interferences from forming in the cell. Operating parameters for analyzing the Si matrix samples are shown in Table 1.
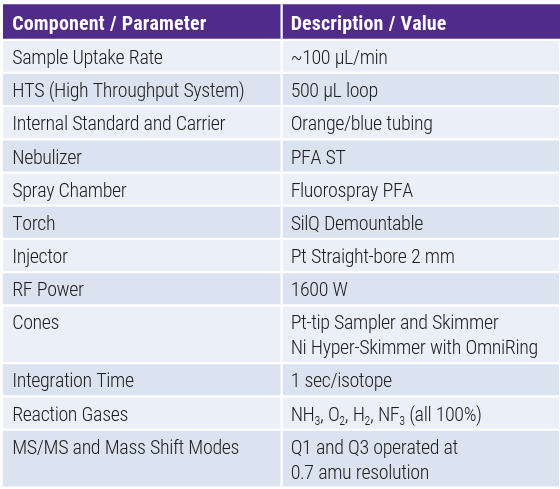
Table 1. NexION 5000 ICP-MS Instrumental Parameters.
Interferences
In routine ICP-MS analyses, two types of interferences exist: non-spectral (physical and matrix effects) and spectral (isobaric and polyatomic).6 When analyzing digested silicon, both matrix and spectral interferences are encountered. Due to the presence of high total dissolved solids (TDS) in the samples, an analyte signal can be suppressed in comparison with no-matrix matched standards, resulting in incorrect analytical answers. Matrix-matching of calibration standards or applying the method of standard addition (MSA) and the use of internal standards are common techniques to compensate for non-spectral types of interferences.
Spectral interferences, both isobaric and polyatomic, are caused by other ionic species having the same or very similar mass to the analyte. In quadrupole-based instruments operating with a resolution of ~1 amu, it means a direct overlap of an interference on an element of interest.
The NexION Universal Cell can work as a collision cell with kinetic energy discrimination (KED) when a non-reactive gas, such as He, is introduced. In Reaction (DRC) mode, the Universal Cell is pressurized with a reactive gas such as NH3, O2, H2, CH3F or others. In the NexION 5000 ICP-MS, MS/MS or Mass Shift modes and DRC technology with several pure reaction gases ensure the most effective interference removal. In MS/MS mode, Q1 and Q3 are set to the same mass, while in Mass Shift mode, Q1 is set to the mass of interest and Q3 is set to a higher mass where the resulting cluster ion resides.
When analyzing silicon matrices, several spectral interferences can affect the accuracy of the results. Therefore, a proper methodology combined with interference management is required. Examples of common Si-based interferences are shown in Table 2.
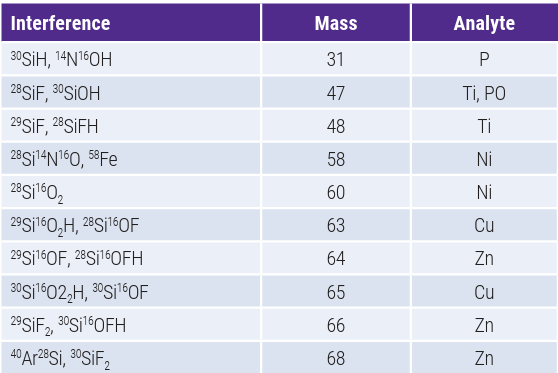
Table 2. Possible Interferences in Digested Si Matrix.
Results and Discussion
This application, as stated in the introduction, has focused mainly on elements interfered by Si species listed in Table 2. Boron does not have Si interferences, but it was included in the analysis given the strong interest by semiconductor manufacturers. Boron and a few other elements from Group III of the periodic table are doped in the pure silicon matrix, creating p-type semiconductor material, while P and a few other elements from Group V are added to obtain n-type material.
Calibration curves generated using the method of standard addition (MSA) for Polysilicon-2 are shown in Figure 1. Even though they were obtained using different modes (MS/MS and Mass Shift) and reaction gases, they demonstrate good linearity. The intercepts represent levels of contaminants in this particular sample.
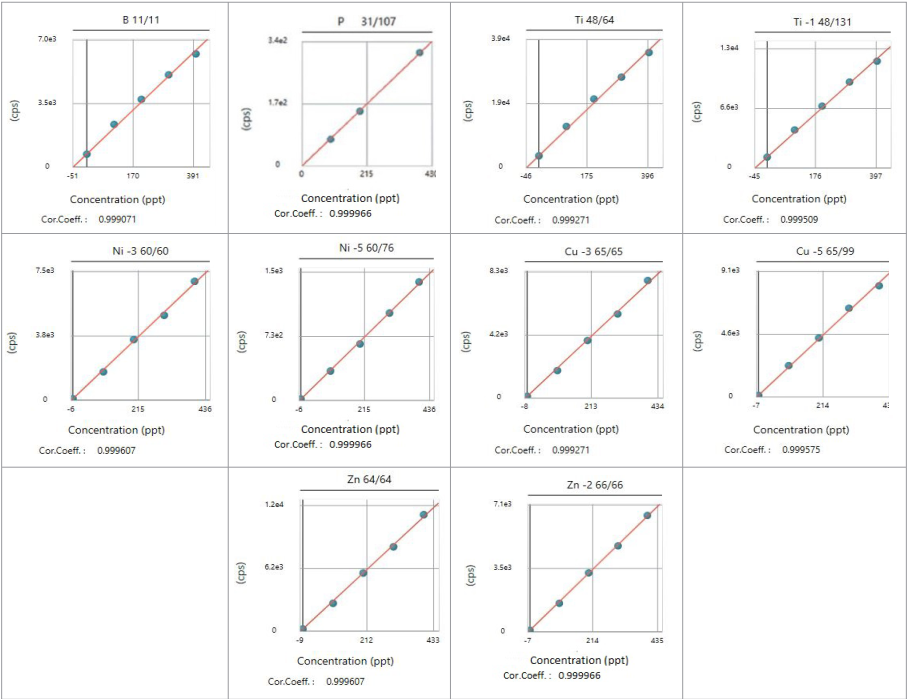
Figure 1. Examples of calibration curves for P 2000 ppm (in 1500ppm Si for P using MSA.
It is recommended, when possible, to use two or more isotopes of an element and two or more different techniques for interference removal. If the obtained results agree, a higher confidence in reported values is achieved. This approach was used to acquire the data listed in Table 3. Several Si materials (wafers and polysilicon samples) were analyzed and results showing contaminant levels are listed in Table 3. In the last column, results of analysis of a Si single-element standard (commercially available) were included showing a surprisingly high amount of contamination of a few elements.
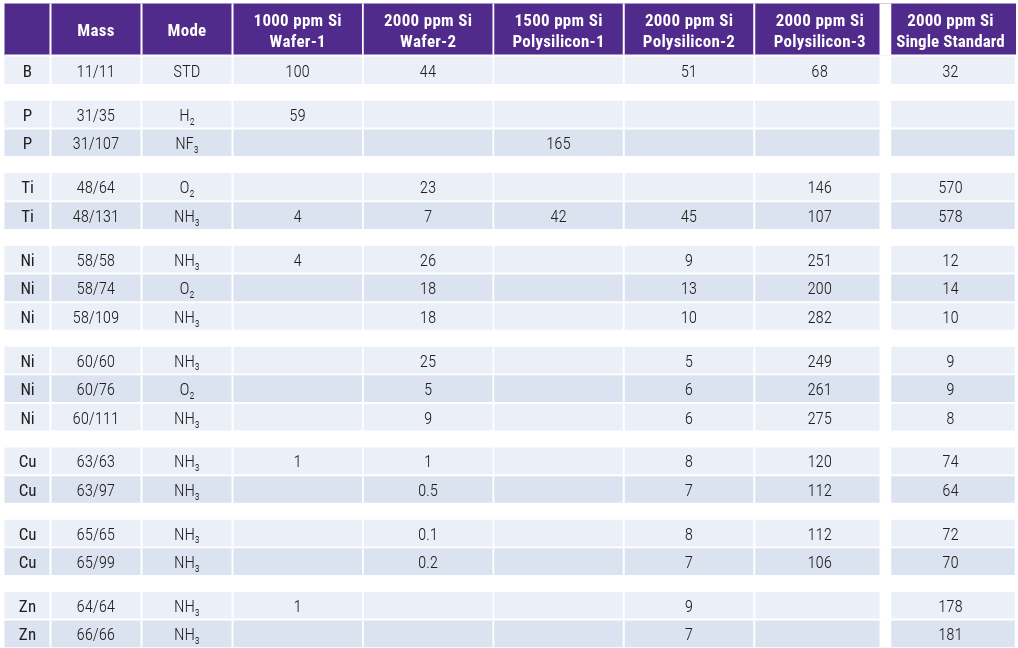
Table 3. Analysis Results of Different Si các Matrices (in ppt).
For example, Ni having SiNO polyatomic and Fe isobaric interferences on mass 58 as well as SiO2 interference on mass 60 was measured using isotopes on both masses in MS/MS mode and in Mass Shift mode with O2 and NH3, respectively. Figure 2 shows product ion scans of 60Ni reacting with NH3 to form cluster ions at masses 77, 94 and 111, respectively, and in Figure 3, 60Ni with O2 creates the NiO+ ion at mass 76.

Figure 2. Product ion scan of 60Ni with NH3.

Figure 3. Product ion scan of 60Ni with O2.
The NexION 5000’s quadrupole UTC with with the active bandpass dynamically controls the gas reactions in the cell. The Rejection Parameter q (RPq) of the Universal Cell could help in weak exothermic or even some endothermic reactions to proceed by providing an extra collision energy. In Figure 4, optimization of RPq aids the Ni reaction with O2 and increases Ni sensitivity. Similarly, Cu was measured at two isotopes in MS/MS and Mass Shift modes with NH3 as a reaction gas. Zinc was analyzed at two different masses in MS/MS mode with NH3 .3One isotope of Ti was used in Mass Shift mode with O2 and NH3Phosphorus, which is greatly affected by spectral interferences (30SiH, 14N16OH), was measured in Mass Shift mode with H2 and NF3 gases in two samples. The use of NF3 as a reaction gas is preferable due to quantitation at high mass (107 amu) where no interferences from Si exist.

Figure 4. Optimization of RPq in 60Ni+ reaction with O2
High concentrations of Si (1000 – 2000 ppm) in the analyzed samples could create a deposit on the cones and a drift of the signal in long runs. A further dilution would affect detection limits of contaminants, so relatively high-concentration Si samples are preferred to be analyzed. However, due to hot plasma conditions and the relatively large diameters of the Pt cones of the NexION 5000, the signal stability of all analytes with one internal standard (In) is excellent. In Figure 5, 100 ppt of 35 elements were spiked into 2000 ppm Si and analyzed 25 times in two hours.

Figure 5. Signal stability for multi-mode analysis of 35 elements at 100 ppt concentration spiked into 2000 ppm Si solution.
Conclusion
ICP-MS NexION 5000 đa tứ cực The NexION 5000 Multi-Quadrupole ICP-MS is shown to be robust and suitable for the routine quantification of ultra-trace impurities at the ppt levels in highly concentrated Si matrices, as required by semiconductor and solar industries. The data demonstrates the effectiveness of Reaction mode in the Universal Cell coupled with the multi-quadrupole operation to eliminate silicon-derived interferences. Concentrated silicon matrices can be analyzed for contaminants, delivering reliable, interference-free results for all elements crucial to these industries.
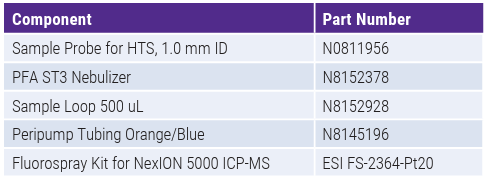
Consumables Used
References
- Wikipedia, free online encyclopedia, https://www.wikipedia.org.
- Wolf S. et al., “Silicon Processing for the VLSI Era,” Vol. 1, Lattice Press, Sunset Beach, CA, 2000.
- “NexION 5000 Multi-Quadrupole ICP-MS”, PerkinElmer Product Note, 2020.
- Badiei H. et al., “Advantages of a Novel Interface Design for NexION 5000 ICP-MS”, PerkinElmer Technical Note, 2020.
- Badiei H. et al., “Multimode Cells and Methods of Using Them”, United States Patent 8,426,804 B2, Apr.23, 2013.
- Pruszkowski E., “Interferences in ICP-MS: Do we still have to worry about them?”, PerkinElmer Technical Note, 2021.
Learn more: perkinelmer.widen.net/content/d9ddapitn5/pdf/app-analysis-of-high-purity-silicon-matrices-for-trace-contaminants.pdf?u=3ezgsz


